You can either choose Current situation in the View menu or click on the  button in ACE Pulse main window.
Current situation provides information about the current status in the selected area view, e.g. how many of its agents that are logged in and how many contacts that are queuing in queues and waiting lists. Some information, such as the service levels, have the Today perspective rather than Current situation.
- The My organisation areas current situation window, which is available if you have selected View my organisation areas, provides summarized information about the current status in all the organisations areas that are included in your access areas.
- The Organisation area current situation window, which is available if you have selected View organisation areas, displays information about the organisation area selected in the main window.
- The My subareas current situation, displays summarized information about the subareas you have access to in the organisation area selected in the main window.
- The Subarea current situation window, which is available if you have selected View subarea displays information about the subarea selected in the main window.
The current situation window for subareas an also be accessed from the Inspector window, which is described more in section Subareas.
Differences between area views and tabs
Current situation for subarea is only displayed graphically, while current situation in my organisation areas and organisation area views also exist as tables.
Since current situation for my organisation areas summarizes the status of sever al different organisation areas at the same time, the service level information is different from the one seen for organisation area and subarea.
The Longest queue time is, for example, always seen with a grey background colour in the my organisation areas current situation because the different organisation areas included, probably do not have the same thresholds meaning that colour coding for current queue time could be misleading.
The Graphic tab and the Table tab
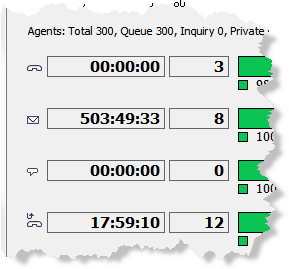
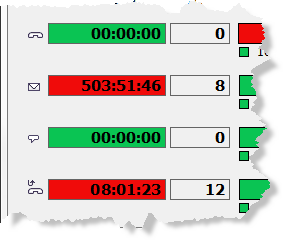
In the Graphic tab, the following information is displayed:
- Total no. of agents (logged in), number of agents Paused, In wrap-up, In contact, In queue, In inquiry, Personal queue, and Ready respectively.
- The length of time in queue or waiting list for the call queued the longest time, regarding calls in progress. This applies to all queues for the subarea, personal queues as well. If a call has been escalated and thereby has been in more than one queue/list, the combined time in the queues/lists is calculated.
- The background in the Longest queue time box changes colour from green to yellow (which means that one of the service levels is not currently fulfilled) and then to red (which means that none of the service levels are currently fulfilled). The colour shows which service level would apply were the call to be served immediately. If the call has to continue waiting, the colour coding can change to a worse level. The thresholds used are those defined at organisation area level.
- Total (number of contacts) in queue or waiting list. One value for email, one for callback calls, one for incoming calls (via IVR), and one for incoming chat. The value does not include those, who have just been served after waiting in a queue.
- Fulfilment of service levels for handled calls, callback records, and emails handled during the day.
 Green
Green
Proportion of contacts having waited such a short time that the more stringent of the two service requirements has been fulfilled. Yellow
Proportion of contacts having waited so long that the less stringent (but not the more stringent) service requirement has been fulfilled. Red
Red
Proportion of contacts having waited so long that neither of the two requirements has been fulfilled.
In the upper part of the Table tab you see all the collected data as text. The difference in information from the one on the Graphic table is the following:
- On the Graphic tab, you can see how many agents there are in contact, while on the text-based Table tab you can see how many that are currently servicing various media such as calls, chats or email contacts.
- On the Table tab you find Detected emails in email accounts displaying the number of emails (received in the organisation area) there is in total in the system. This sum includes:
- Emails in queues and waiting lists.
- Emails that have not yet been downloaded to queues/waiting lists.
- Emails that are currently being processed, and therefore have not yet been deleted.