Everyone with the access rights to use ACE Report can create personal and global tailored reports and change their own tailored reports. The workspace where you create and modify tailored reports is opened when you,
- in the Report picker have selected a tailored report or a statistics collection and then click on one of the Modify or Copy/Create, followed by OK in the name specification window that is opened.
- in the File menu, have selected any of the Import tailored report or Convert tailored report from CallGuide Stat menu choices.
Overview of the Modify Report tab
How you configure your report, i.e. select grouping conditions and layout settings, rule which columns there shall be and the terms and formulas that are to be included is described below.

 Day,
Day,
 Week,
Week,
 Month,
and you can change that via the drop-down menu, provided that the already selected grouping criteria or columns are not using any concept connected to the original time unit
Month,
and you can change that via the drop-down menu, provided that the already selected grouping criteria or columns are not using any concept connected to the original time unit
 you move the selected column to the wanted position. The column's header will automatically become the selected statistical term's name. If you want to have another name for the column header in your report, you select the term here in the column list and enter your own text in the Column name field. The maximum number of columns is determined by the layout you have chosen.
Grouping conditions
In ACE Report a report is normally not just rows with values in different columns, but it can also contain sum-ups that you can click on to see the details, with so-called drill-down. Most often there is also a total at the end of the report.
To apply sums and drill-down, a tailored report must be grouped on at least one of the terms that are included in the report's underlying statistical collection. Grouping makes subtotals possible for each unique value in a grouping condition. If you e.g. in a report presenting task statistics for calls, have selected the Task type grouping condition, you see a subtotal for each existing task type and a total for all task types that can be connected to the calls in the customer service.
To create grouping conditions for your tailored report you select at least one and a maximum of five terms at the bottom left part of the Modify report tab. In a drop-down menu you see the most common statistical terms for the type of report. If you want to use other terms, you tick the Show all terms checkbox. In the drop-down menu you then see all terms included in the current statistics collection.
Select, in the drop-down menu, the term you want to group by and click on + to add the term to the Grouping conditions field.
To remove a term from Grouping conditions you select the relevant term and click on -.
The relative order between the grouping terms is also important. If you e.g. group by Agent and Task type and want all task types for agent A to be displayed before the task types for agent B, the Agent term must be placed before the Task type term. You can change places for already selected grouping terms by selecting the relevant term in the grouping condition and click on one of the
arrows.
Layout
Each tailored report normally has
- columns with headers
- a number of pages, where page breaks are normally made from the chosen layout. If e.g. the layout is portrait A4, each page is contained in one portrait A4 at printout. See below.
- a report header at the top of each page, similar to the one described in section Content of the report header.
A built-in standard layout rules the look of the report header, the colours and fonts used, as well as the columns' positions and widths. Under Layout setting you can affect e.g. page breaks and how report headers and columns are displayed.
In a drop-down menu you first select size and orientation:
- Portrait A4, max six columns
- Landscape A4, max ten columns
- Portrait A3,max ten columns
- Landscape A3, max fifteen columns
If your report uses fewer columns than the maximum specified above, you have the option of having the columns use the layout's default column widths or distributing the columns over the total width of the report by selecting Adjust column widths to report width. The exception is reports using formulas constructed with Crystal Reports syntax. For technical reasons, column width cannot be re-configured for these reports.
The following layout features are particularly useful if you are exporting a report to e.g. Excel, and maybe you just want to include the rows with values. Select by ticking the appropriate checkbox:
- Hide page header
if you do not want any header at the top of each page.
- Hide grouping condition caption
if the grouping condition's unique value must not be seen above each group summary.
- Show group details at to level
if the detail rows for each group summary shall be seen directly at the top level of the report. This means that you cannot use drill-down.
- Hide group summary line
if you do not want a line above each group summary.
- Hide group summary
if you do not want to see any group summary.
- New page after group
if you want to have a page break after each grouping. This could be good if you have selected to show group details at the top level.
- Hide grand total
if you do not want to see any grand total.
Terms and formulas
Each term is in reality created by a formula. The terms are found in the statistics collection and a formula can also be constituted by a combination of these terms. Since a tailored report can present values in three ways - grouped, detailed, and as a grand total - each formula must consist of three versions, each version with regard to the various presentation ways.
In Modify report you can configure formulas to the report's columns using the following methods:
- Under the Terms (or formula) tab you can select separate statistical terms from a list, as described above. ACE Report creates the formulas and consequently you do not have to know how the formulas must be constructed to function for the various presentation ways. Under the same tab you can also combine several statistical terms.
- In the Advanced formula tab you enter the formulas in the formula language for Crystal Reports.
This is an example describing the three ways for presentation in a report.
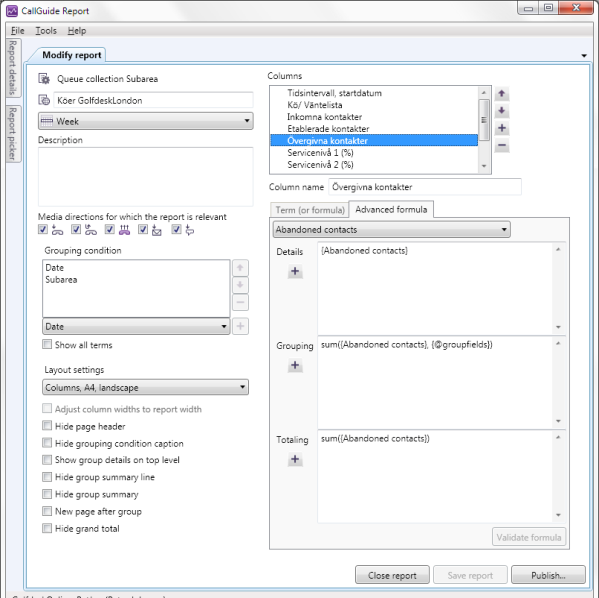
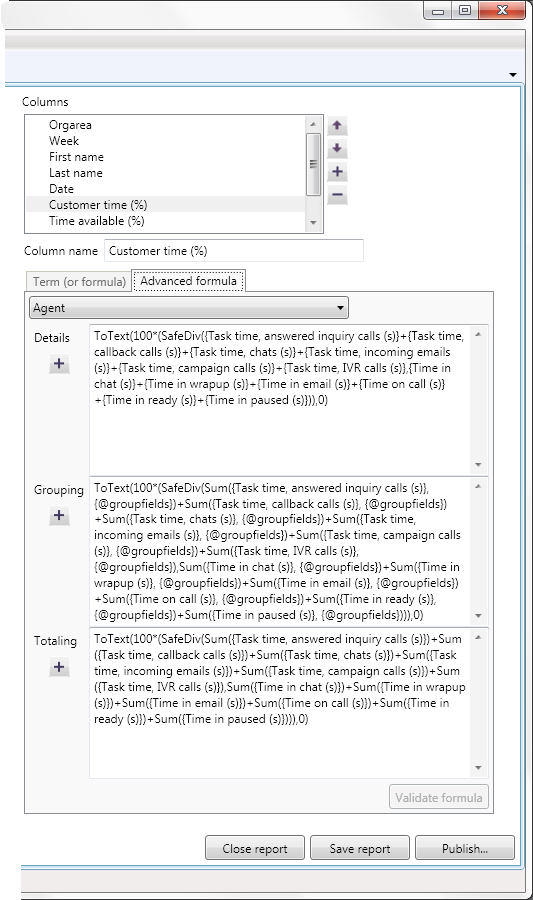
To the right in Modify report a column is selected in the column list. Below it, in the Advanced formula tab, you see the formula for the column, divided into the three presentation ways.
- In Details you see the term selected from the statistical collection.
- In Grouping you see the term with the @GroupFields grouping term.
- In Totaling you see the term with the totaling term.
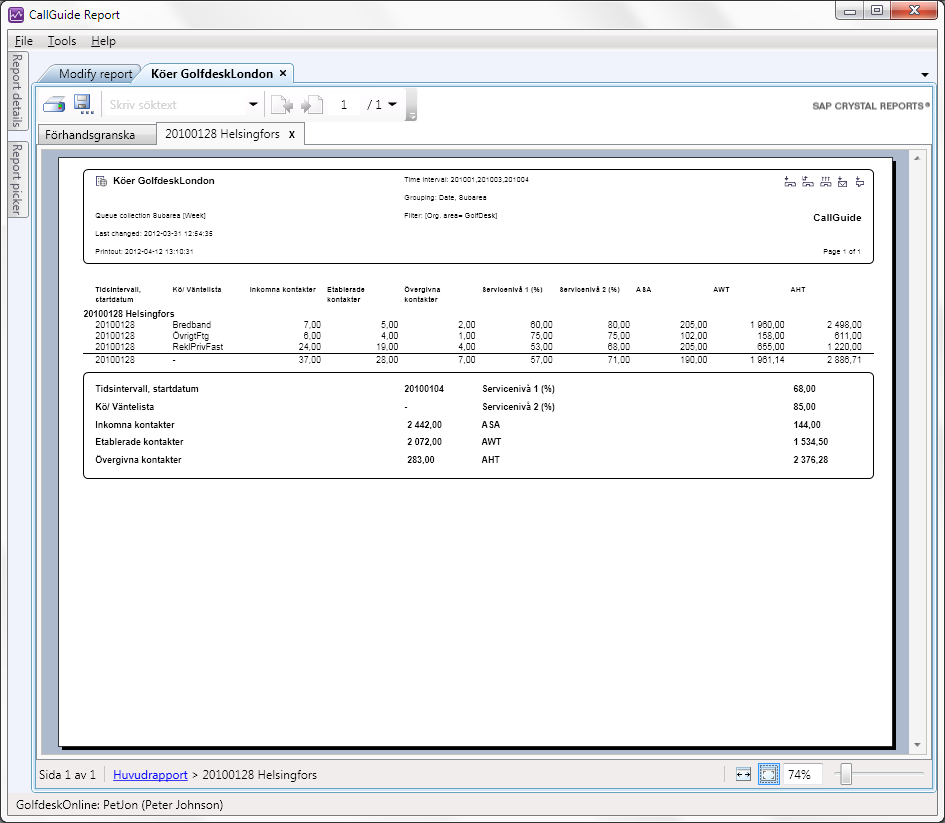
In Grouping conditions in the left part of Modify report above, the statistical terms Date and Subarea are included. You see the grouping to the left below, in the left column of the report. For numerical values such as Average value the group summary is seen as a sum. For strings, such as Date you just see a dash -, indicating that more values are hidden in the detail rows. When you click on a row in the column, you drill down into the report to see the details as seen to the right below. In this case you also see a grand total on the same report page.

Combine several statistical terms in one column
This is how you do to combine several statistical terms in one single column:
- Create a column with +
- Select the first want term under the Term (or formula) tab and press Enter. The term is then moved up in the column list.
- Then enter any of the normal arithmetic operators in the editing pane after the first term, i.e. plus +, minus -, asterisk (multiplication)* and slash (division) /. You can also use numerical constants here, such as 10 and 5.5 as well as parentheses.
- Search to find the next term in the editing pane in the same way that you found the first one.
- When you press Enter you see the term in the editing pane and you can now continue adding more operators etc.
- If a formula is not complete, or contains syntax errors, ACE Report will indicate this by an exclamation mark in the column list and then you see the text field with a
 yellow background colour.
If you are using several terms you must give the column a specific collection name, as it is just the first selected term's name that is transferred to the Column name field.
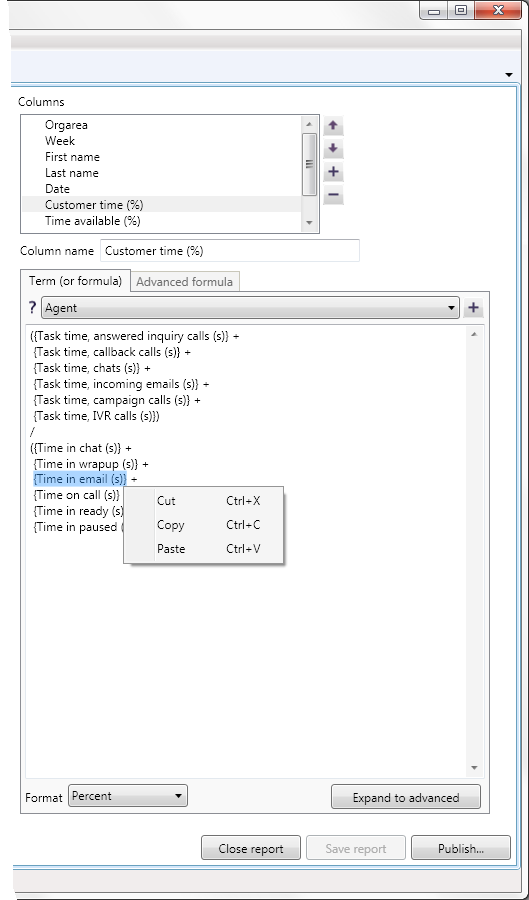
Ctrl X
In the field where you select terms and create formulas you can select an entire statistical term by just clicking on it. You can copy Ctrl C cut Ctrl X and paste Ctrl V terms and formulas via a context menu or key board commands. You can also use Ctrl Z to undo the last entry, a number of steps back.
Format for values and export to Excel
You can change the presentation of a column's value in the report by changing format. In the Terms (or formula) tab you do this via the Format drop-down. Select the relevant column at the top of the column list and select one of these formats from the drop-down menu at the bottom by Format:
- One decimal. E.g. for terms including Weighted average value
- Two decimals
- Integers. E.g. for terms including Count and Max/min value
- Percent. E.g. for terms including Percentage
- Time HH.MM.SS. Terms including time are normally counted in seconds. 7,201 seconds can be seen as 02:00:01
If you select format for a text based term, this will not have any effect when the report is displayed.
When a formula uses a built-in format, the value of the formula is represented in the report as a sting, just a sequence of characters, even if the value is a number. This is of no importance whatsoever when you look at the report in ACE Report. On the other hand, if you export the report to Excel, you have problem of Excel not perceiving numerical data as numbers. In order to (partly) solve this, ACE Report ignores some formatting when a scheduled report job is using Excel as target.
Advanced formula
An advanced formula is a formula that has been expanded to Crystal Report's formula language, which can be useful if the standard formulas are not sufficient to solve your needs in your organisation. An advanced formula can e.g. sum up a number of columns, create differences, products, or find max and min values.
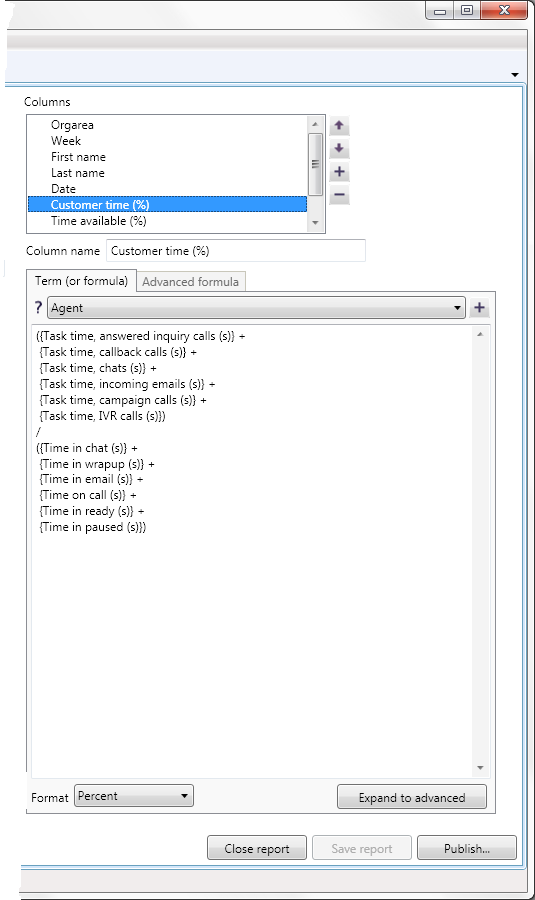
The pictures below shows a column's formula, as seen in the Term (or formula) tab and as seen in the Advanced formula tab.
In ACE Report advanced formulas are created in the Advanced Formula tab, which can be opened in two ways:
- By a standard formula being expanded to advanced formula; this happens when you have a report open in Modify report, the Term (or formula) tab and click on the Expand to advanced button.
- By a tailored report from CallGuide Stat having been converted in to ACE Report, i.e. that you, in the File menu have selected Convert tailored report from CallGuide Stat.
Configuration of advanced formulas differ somewhat from the handling of standard formulas. This how ACE Report's Advanced formulas tab functions:
- Each formula is configured separately for the detail, grouping and grand total levels.
- In the Details field you specify the formula for the data fields, i.e. the formula applying to the values that are seen by rows at detail level.
- In the Grouping field you specify the formula that applies for the group summary. When you group the tailored report by one of several terms, this grouping term is named @GroupFields in the editing pane. If you do not specify anything here, an empty value will be seen in the report's grouping. In the same way as in the Term (or formula) tab, the grouping columns in the report will be seen in the order they are presented in the column list.
- The Grand total field contains the formula for grand total.
- You select a term from the drop-down menu above Details, Grouping and Summary. Add the term with the + plus button by each editing pane. The term is inserted where you have your mouse cursor.
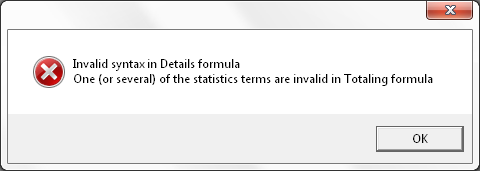
- You specify mathematical operators etc. ACE Report does not check recurrently that an advanced formula has a correct syntax. On the other hand you can use the Validate formula button at the bottom right of the Advanced formula tab before you save the report. A dialogue box then shows what you should attend to.
- To be able to save a formula you must give it a name that is then presented as column name in the report.
- You can modify and/or remove the formula later.
Formula examples
Below you find a choice of accepted syntax examples that you can use when you are creating an advanced formula.
- {Time in call (s)} + {Time ready (s)} + {Time in wrap-up (s)}
- 100 * {Tim paused (s)} / ({Time in call (s)} + {Time ready (s)} + {Time in wrap-up (s)})
- 100
- 100.789
- -100
- + {Answered IVR calls} - 100.789
- {Answered IVR calls} / (-100)
- 100 * - {Answered IVR calls}
- {Time paused (s)} + - {Time in call (s)}
- -{Answered IVR calls} * (-{Answered IVR calls}) - {Answered IVR calls}