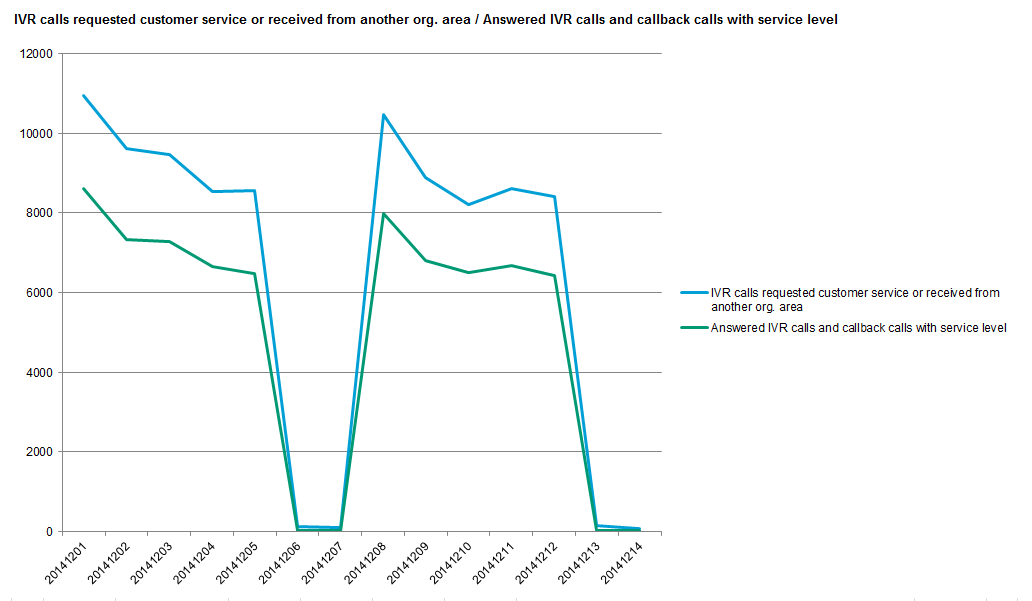
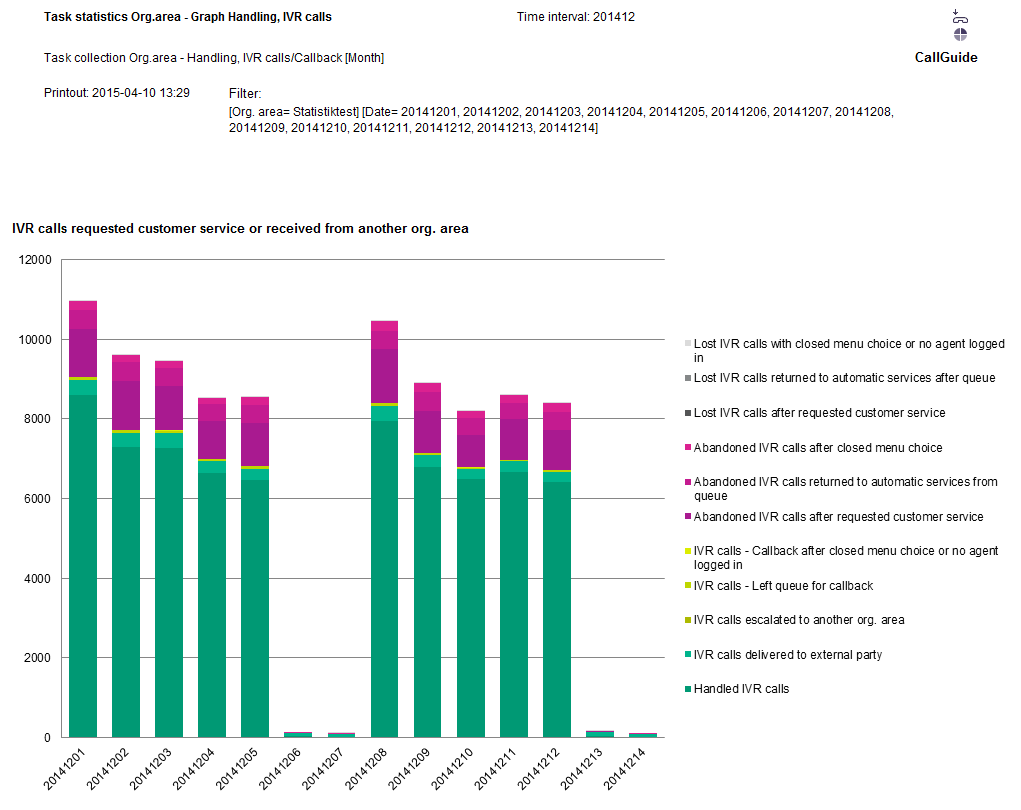
Most reports are presented in ACE Report work area. However, among the standard reports there are some presenting the statistics graphically. These are opening up in a separate Microsoft Excel window. Consequently. to be able to show graphical reports, Microsoft Excel must be installed on your computer.
You see which they are by the name of the report, such as
- Task statistics Org.area – Graph Handling, IVR calls
- Task statistics Org.area– Graph Average day, IVR calls
The file type for these reports are .xlsm, Excel Macro-enabled Workbook, because each report is built on a template document with Excel macros that are filled with statistics by ACE Report. So, you may have to change how Excel allows content. It may be clicking on OK for warnings such as ”Enable content" or to allow all macros to run in Excel, which is done via the Excel Developer tab, or under File | Options | Trust Center | Trust Center Settings | Macro Settings.
Because the report is opened in Excel, the presentation, saving and the forwarding of the report is completely separated from ACE Report and the functionality is the same as normally offered in Excel. In all other aspects the graphical standard reports function just as all other standard reports, meaning that they can e.g. be scheduled.
The graphical report consists of two tabs:
Report where you see the graphs with the details described to the right of each respective graph.

Data where you see the statistics used in the previous Report tab.
