ACE Monitor is a real time monitor, made as a wallboard in your web browser.
As an administrator you decide what to display to coaches and agents - both in content and layout.
- Create pages and choose which type of cards you want to display in each page.
- Select which real-time data is to be picked from ACE.
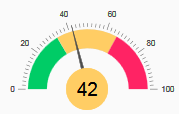
- Choose how figures are to be shown; in a multi value list, a gauge or as a single value.
- Set the service level thresholds, and display colours as they are exceeded.
- Display web pages from Intranet or www, within their own cards on your wallboard.
- Present messages from the coach. See Best practice for ACE Monitor.
- Move and resize the cards with drag-and-drop.


To get started, see Set up your ACE Monitor and Card types in ACE Monitor.
Pick data from ACE
Some examples of the ACE information available for display in your ACE Monitor.
- Contacts in queue right now, average queue time and longest time in queue.
- Received, handled, escalated, lost and abandoned contacts
- Agents' time in various statuses, such as pause, in call and in chat
- Statistics regarding answered calls for campaigns
Descriptions of the concepts can be found in help topics related to queues' and agents' details in ACE Pulse. See e.g. Queue details - Overview tab and Queue details - Table tab.
The statistics are described in Statistics terms from A to Z, where each English term is also seen together with its Swedish and Finnish equivalent.