ACE Statistics
All about statistics and real time information
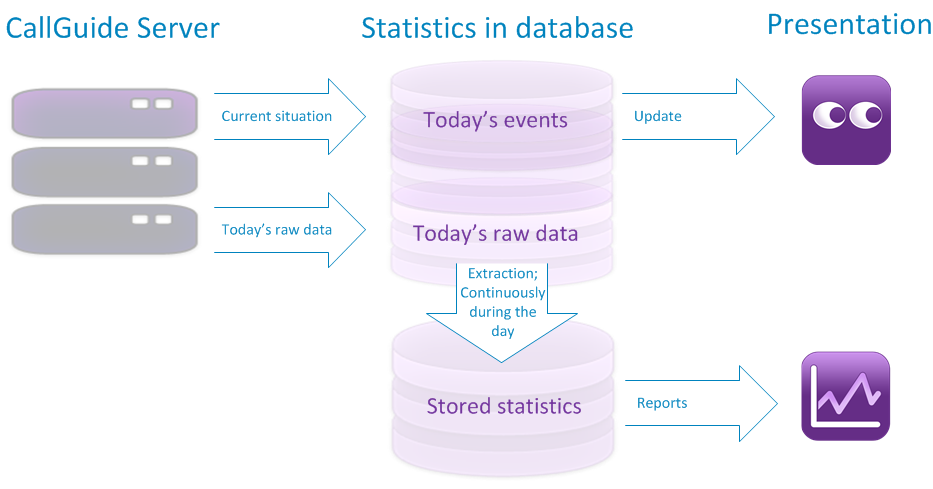
In Telia ACE, a lot of information is saved currently to be presented during the day as realtime information and after being processed as statistical reports. This means that a certain amount of information about what has happened in ACE today has not been processed and a certain amount has been processed to be used in future.
-
 Today’s information, i.e. real time monitoring, is found in ACE Pulse and
ACE Monitor.
 -
 The processed information from yesterday and backwards can be seen in the ACE Report statistics client.
In the picture below you see the flow; how statistics and real time information are created and presented.

Statistics in ACE use a number of terms that are important to know in order to understand connections and the various reports. You fid all details gathered to the left.
The statistics are described in Statistics terms from A to Z, where each English term is also seen together with its Swedish and Finnish equivalent.
Real time information
Real time information summarizes the current situation in a ACE solution and can be seen as snapshot pictures in the ACE Pulse application. This is where you can find the answers to questions such as:
- What are the waiting times for my queues now?
- Are my agents logged in?
- How many calls have we answered today?
- What proportion of the calls have been answered within the thresholds for waiting time?
The realtime information is reset every night for accumulating counters of today’s events. However, information about current processes such as logged-in agents, contacts in queue, etc is not reset.
Today’s unprocessed statistics
Contain detailed information for each
- change in status that agents have undergone during the day,
- contact created during the day.
The historical account is created continually by ACE Server at the same pace as events happen. Today’s unprocessed statistics are compressed (extracted to so-called extracted statistics currently during the day. History is stored separately for each organisation area.
To obtain the unprocessed statistics, transfer can be made to a separate database for further analysis. The statistics presented in ACE Report are built on the extracted statistics described below.
Processed information, compressed/extracted statistics
Today’s unprocessed information is compressed (extracted) to so-called extracted statistics currently during the day. History is stored separately for each organisation area.
The extracted statistics contain conclusive information about events summed up per time unit, normally half-hour (the time unit is configurable), answering questions such as:
- How many calls did we answer last week?
- What was the average waiting times for yesterday queues compared with month average?
- What proportion of the telephone calls were answered within the thresholds for the waiting times for the various menu choices last month compared with this month?
The reason for creating extracted statistics is partly not wanting to save each event for space reasons, partly wanting to save data in a way adapted to the statistics reports included and to be presented in ACE Report.
The extracted statistics are independent from the currently valid configuration in ACE Admin. This is absolutely necessary since you must be able to view statistics several months back in time without changes in ACE Admin (for example removal of an agent) influencing the result. The access rights to view statistics are, however, entirely ruled by the current configuration in ACE Admin.
Statistics for earlier days are available in the database to fetch for reports. However, statistics older than a configurable amount of days are placed on files for space reasons. When required, old statistics can be placed in the database again. Typically, statistics for the last year are placed in the database.