Which card types you can place in your ACE Monitor wall board depends on:
- Your access areas and access functions.
See Using Pulse, Monitor and Report and Best practice for ACE Monitor
. - Choice of Data origin in ACE Monitor, as described in Set up your ACE Monitor.
Common to all cards is a Preview area, simultaneously updated as you change any details in a card, and that you save with OK.
Real-time data in gauge or as numbers
If you want to show real-time data from the contact centre, with values from ACE statistics concepts, use one of the following as Data origin:
-
 Queue
Queue -
 Subarea
 -
 Task type
 -
 Campaign
 -
 Organisation area
The card types Gauge, Value and Value list are displaying the data in different layouts.
-
 Gauge
Gauge - The gauge needle shows present status. The needle shows the amount of contacts in queue. The background between 10 and 30 is yellow.
-
 Value
Value - The number displayed is the real-time value from one selected statistics concept. The digit shows the amount of contacts in queue.
-
 Value list
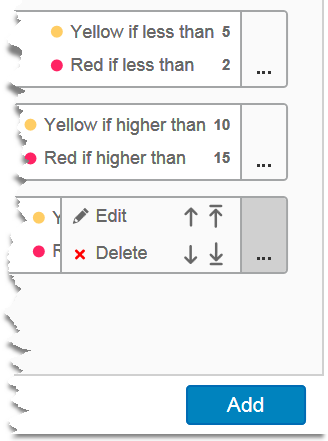
 - Shows multiple values, for the statistics concepts chosen by you. Show yellow background if less than five agents are available and if more than 10 calls are in queue.
How to add content to these three real-time data cards:
- Type the card's Header manually, or leave it to be set to data name chosen below.
- For the card type Value list, set the Text size, scaled as 1-10.
- Pick a background colour to the white Data origin icon. The icon will be displayed to the left of the header.
-
Depending on Data origin, choose the applicable.
- Subarea
- Task type
- Queue / Waitinglist
- Campaign
- Under Value, choose from a list of statistics concepts. Tick Show only recommended to hide the less common terms. Type to narrow down the list.
- Choose if Thresholds warnings are to be seen when a value exceeds or falls below entered numbers, and set the limit for Yellow and Red warning colours.
- For the card type Gauge, also set the scale's range, i.e. the upper and the lower limit of the needle, by adding Min and Max numbers. Also, set time format such as Seconds or Days.
- For the card type Value list, click Add to choose additional statistics concepts, and ... to see the available edit options.

Value collections for queues
The following cards shows collected real time status summarized for a selected queue.
-
Workforce
- Contains names and status of the agents logged in. The content can be sorted by clicking any column header.
-
Potential workforce
- The agents that could serve the selected queue. When creating the card you can choose to exclude agents not logged in. The content can be sorted by clicking any column header.
-
Queue status
- Status for several queues gathered in one card. Shows the number of agents logged in, the amount of contacts in queue, queue times and service level fulfilment.
-
Queue table
- Status for several queues gathered in one card.
- Select queues with drag and drop.
- To drag multiple queues, select when pressing Ctrl or Cmd.
- To sort the content, click any column header.
Value collections for campaign
-
 Campaign status
 - Gives a continuous summary of the outcome from calling campaign records.
Close is the number of calls having ended with a feedback indicating success, such as "the customer accepted the offer".
Calls made is the sum of dialled out calls.
Declined and Inapplicable are counting the calls where the results are less successful, as explained in Feedback for campaign calls.
Hitrate, the percentage of closed calls where the campaign offer could be presented, for today and for the entire duration of the campaign.
The Campaign status card gives a continuous summary of the outcome from calling campaign records.
Header, embedded content and message
The more general card types Header, Embedded content and Message are found under Other.
-
 Header
 - The name displayed over a group of cards, or as the page name, such as Traffic situation for Team #1
How to add content:
- Type Text, e.g. the title to your entire page or part of a page.
- Choose Alignment, such as e.g. centred.
-
 Embedded content
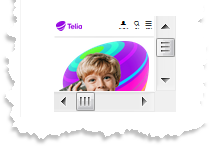
 - Shows e.g. a web page in chosen card size, such as https://www.accuweather.com
How to add content:
- URL. Enter the address to a web page.
- Choose Refresh rate such as e.g. None, 5 seconds or 30 minutes.
- Select a Scale factor 20-200% i.e. a zoom level to alter the displayed size of the web page.
- If the target web page is exceeding the size of the card you will see scrollbars. You might want to enlarge the card, or at least tick the Hide scrollbars option.

-
 Message
 - Displays the latest message sent from a ACE user. Can be any text, like Today we celebrate! Pick up your treat in the reception...
How to add the card:
- Enter a first Example text which only seen on your computer, and will be overwritten as soon as a real message arrives.
- Set the Text size, scaled as 1-10.
- If the amount of characters does not fit into the card, the text will be automatically scrolled. Set the desired Text scroll speed.
How to add content:
The card displays messages sent from ACE Admin or ACE Pulse to the user logged in to the devise displaying the real time data.
The area affiliation of the message sender, the creator of the page respectively the card in ACE Monitor and the ACE user signed in on the monitor devise are vital. See Best practice for ACE Monitor.
Auto generated messages from the ACE system, e.g. about technical problems or when you need to change your password, is displayed in a frame at the top of your page. Click on it to open and see the full content, and close it with x.